Integrating spatial datasets with SCTransform and feature selection
I’ve started working on a few different spatial datasets, as we have our workflow set up around Seurat (you can view our Docker images for our analyses) that’s what I’ve been using to do spatial analysis as well.
Integrating spatial datasets with SCTransform
As aspect that I don’t think is immediately obvious is that Seurat vignettes don’t explain how to merge together spatial datasets from different groups or experimental conditions. While I am pretty sure this falls under integration as in their single-cell RNA sequencing vignette, there do appear to be numerous questions for confused individuals on their Github especially about merge vs integration. It also doesn’t help that the vignette for spatial is titled Analysis, visualization, and integration of spatial datasets with Seurat, but the integration here is for integrating with single-cell data for deconvolution. I think terminology and/or definitions for merge and integration could be much clearer with the Seurat ecosystem in general. For example, the vignette could be retitled to ‘Spatial data with Seurat: analysis, visualization, and integration with single-cell’ or ‘deconvolution’, something more specific.
Anyway, also as of currently there is a bug when it comes to integrating spatial data with SCTransform. If you try the standard approach you will get the following error:
Error in scale.data[anchor.features, ] : subscript out of bounds
The issue and workaround was described in this issue, where it appears to be due to SCTransform expecting an assay called “RNA”, and of course we only have the slot “Spatial”. So basically, you need to do
obj[["RNA"]] <- obj[["Spatial"]]
Unfortunately it doesn’t look like anything has been pushed to Seurat yet for this.
How many features to select for integration?
While working on this, I also decided to explore how many features were appropriate for integration. In the regular workflow of Scale, Normalize, etc. it seems like integration is quite sensitive to the number of features chosen, the developers suggest using SCTransform instead which due to weighting genes based on biological variation will have less sensitivity to the number of features, as additional features used will have lower weights anyway. (Aside: I don’t know why they don’t just make SCTransform the standard workflow, I see no reason to use the Scale, Normalize, etc. one over SCTransform) To confirm this I did a small test, where I used 3000 (the standard), 2000 (less than the standard) and 500 (minimal) to see how that impacted results, if at all.
feature_test <- function(x, nfeatures=3000) {
features <- SelectIntegrationFeatures(x, nfeatures=nfeatures)
intlist <- PrepSCTIntegration(x, anchor.features=features)
anchors <- FindIntegrationAnchors(intlist, normalization.method="SCT", anchor.features=features)
intdat <- IntegrateData(anchorset=anchors, normalization.method = "SCT")
}
clustering_test <- function(x) {
x <- RunPCA(x, verbose=FALSE) %>%
RunUMAP(reduction="pca",dims=1:30,verbose=FALSE) %>%
FindNeighbors(reduction="pca",dims=1:30) %>%
FindClusters(resolution=0.3)
}
intdat_standard <- feature_test(minus_m6) %>% clustering_test()
intdat_less <- feature_test(minus_m6, nfeatures=2000) %>% clustering_test()
intdat_minimal <- feature_test(minus_m6, nfeatures=500) %>% clustering_test()
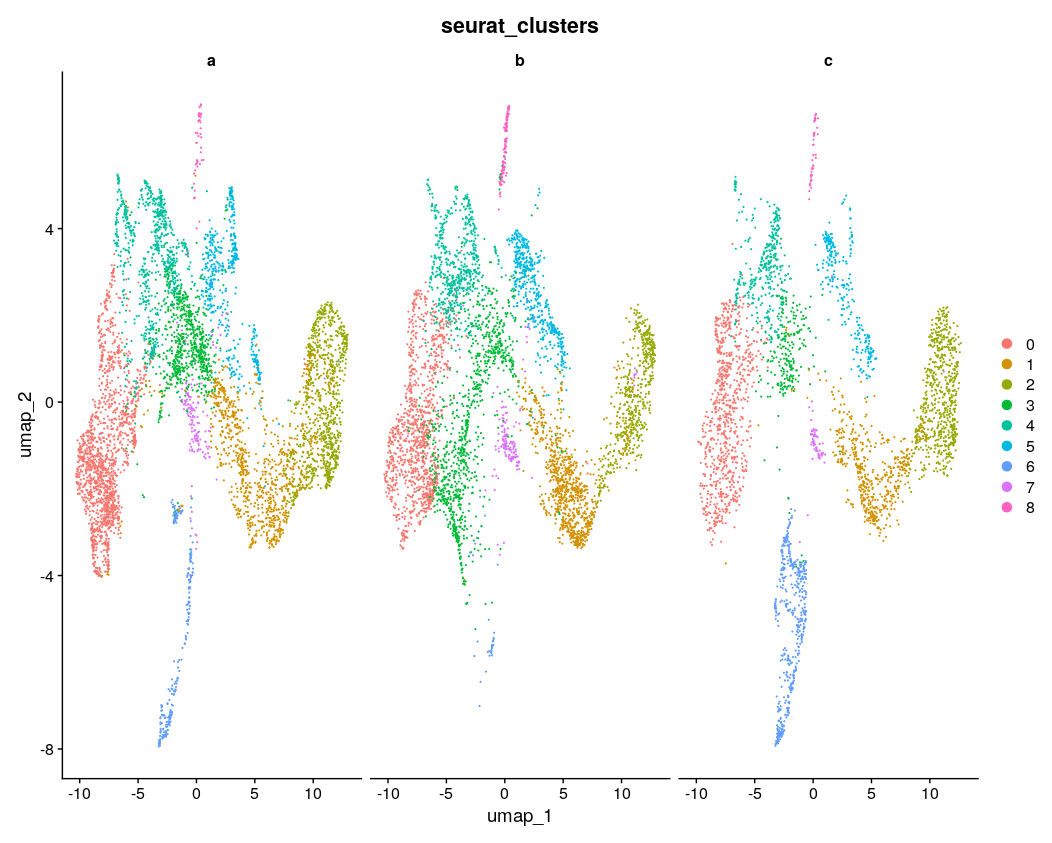
DimPlot(intdat_standard, reduction="umap", split.by="anon.ident") + theme(legend.position="none")
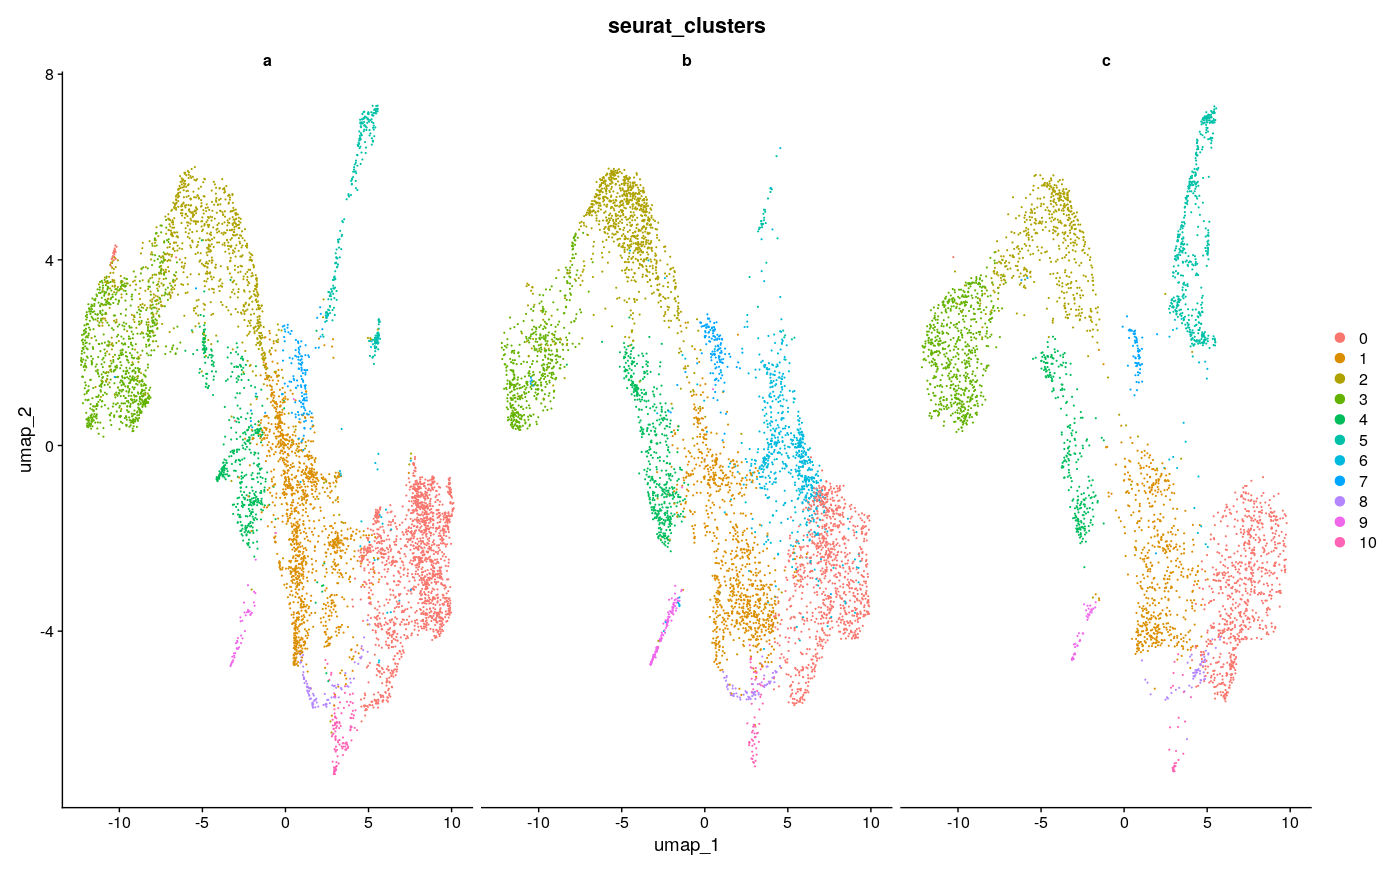
DimPlot(intdat_less, reduction="umap", split.by="anon.ident") + theme(legend.position="none")
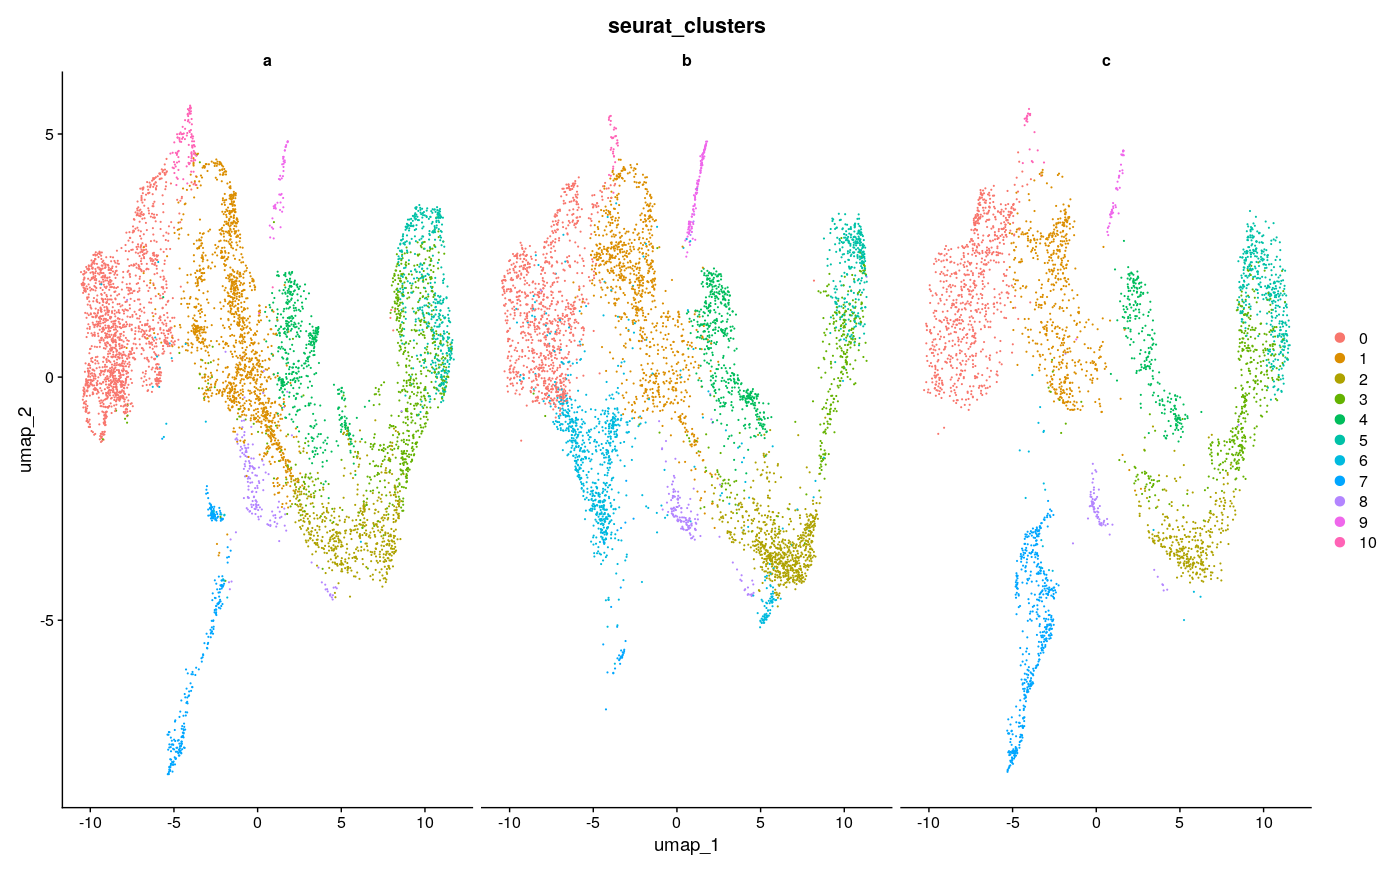
DimPlot(intdat_minimal, reduction="umap", split.by="anon.ident") + theme(legend.position="none")
Results
 |
 |
Conclusions
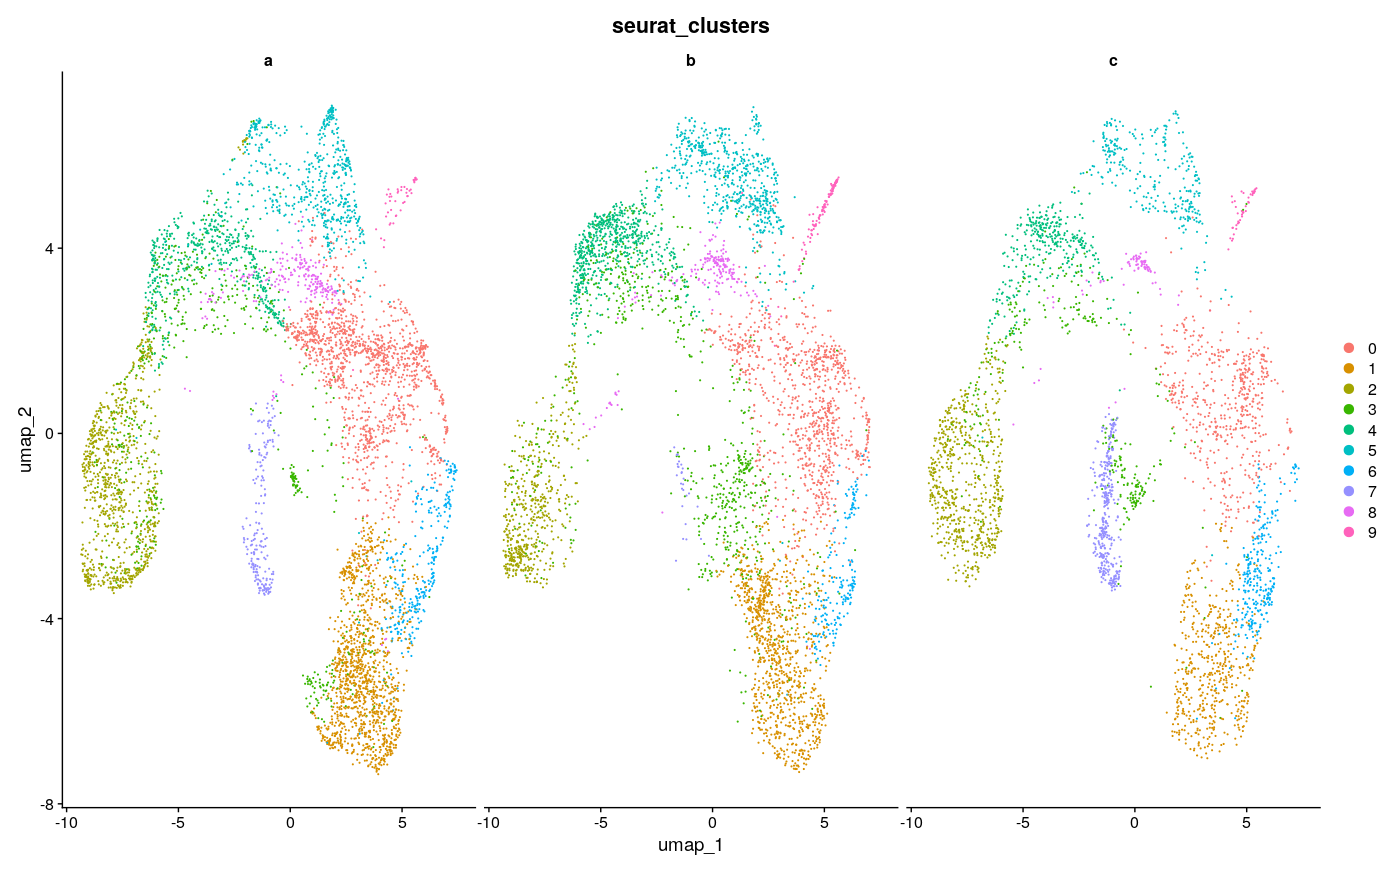
Visually, it seems like 3000 features achieves the best consistency on this dataset, with less features doing worse, but none seem to do have major lack of consistency as compared to the example in the Github issue, to speak to the point of reduced sensitivity to feature number with SCTransform. There were ~4500 max variable features usable here, so I took a look at using the max as well. Visually it looks a little less consistent. It also seems that with minimal features and maximal features the number of clusters gets reduced, which creates the appearance of inconsistency, as for example the green cluster #3 in the maximal UMAP for b is split into at least 2 clusters in the UMAP for 2000 and 3000 features, with 1 of those clusters only being featured in b.
The general sense I get is that using too little features and too many features could be a problem, as one might expect, but somewhere in-between seems to be fine. And at least on this dataset the standard suggested in the vignette of 3000 features also works fine. I’m not sure and have not explored what downstream impacts this has, but I doubt they are large - rather, the number of features should probably be more like a QC check to see that you have not used too few nor too many. Choice of clustering parameters of course have great impact and have much more research dedicated to them as a result, as discussed in Menon et al. 2021, Wong et al. 2023. There was also this nice paper that I used as a guide for some of my own explorations with tSNE parameters, although those only affect visualization.